5.2. Create an Alert Dashboard
Alert Dashboard are used to specify which metrics are critical and when to send alerts for those.
Speedgain for Databases comes with a built-in alert dashboards that has some basic alerts already defined. It can be used as a template to create a custom one. The built-in board can not be changed and therefore can only be used as a template.
5.2.1. Save existing one as a copy
-
login to grafana (open up the speedgain for databases url with port 3000 - default port)
-
open the "S4DBs Alerts" dashboard (Url: …:3000/d/1iJVQ9uMz/)
-
hit the gear icon (settings)
-
click on "Save as.."
-
Give the dashboard a name of your choice, select a folder or create a new one, enable copy tags and click on save
-
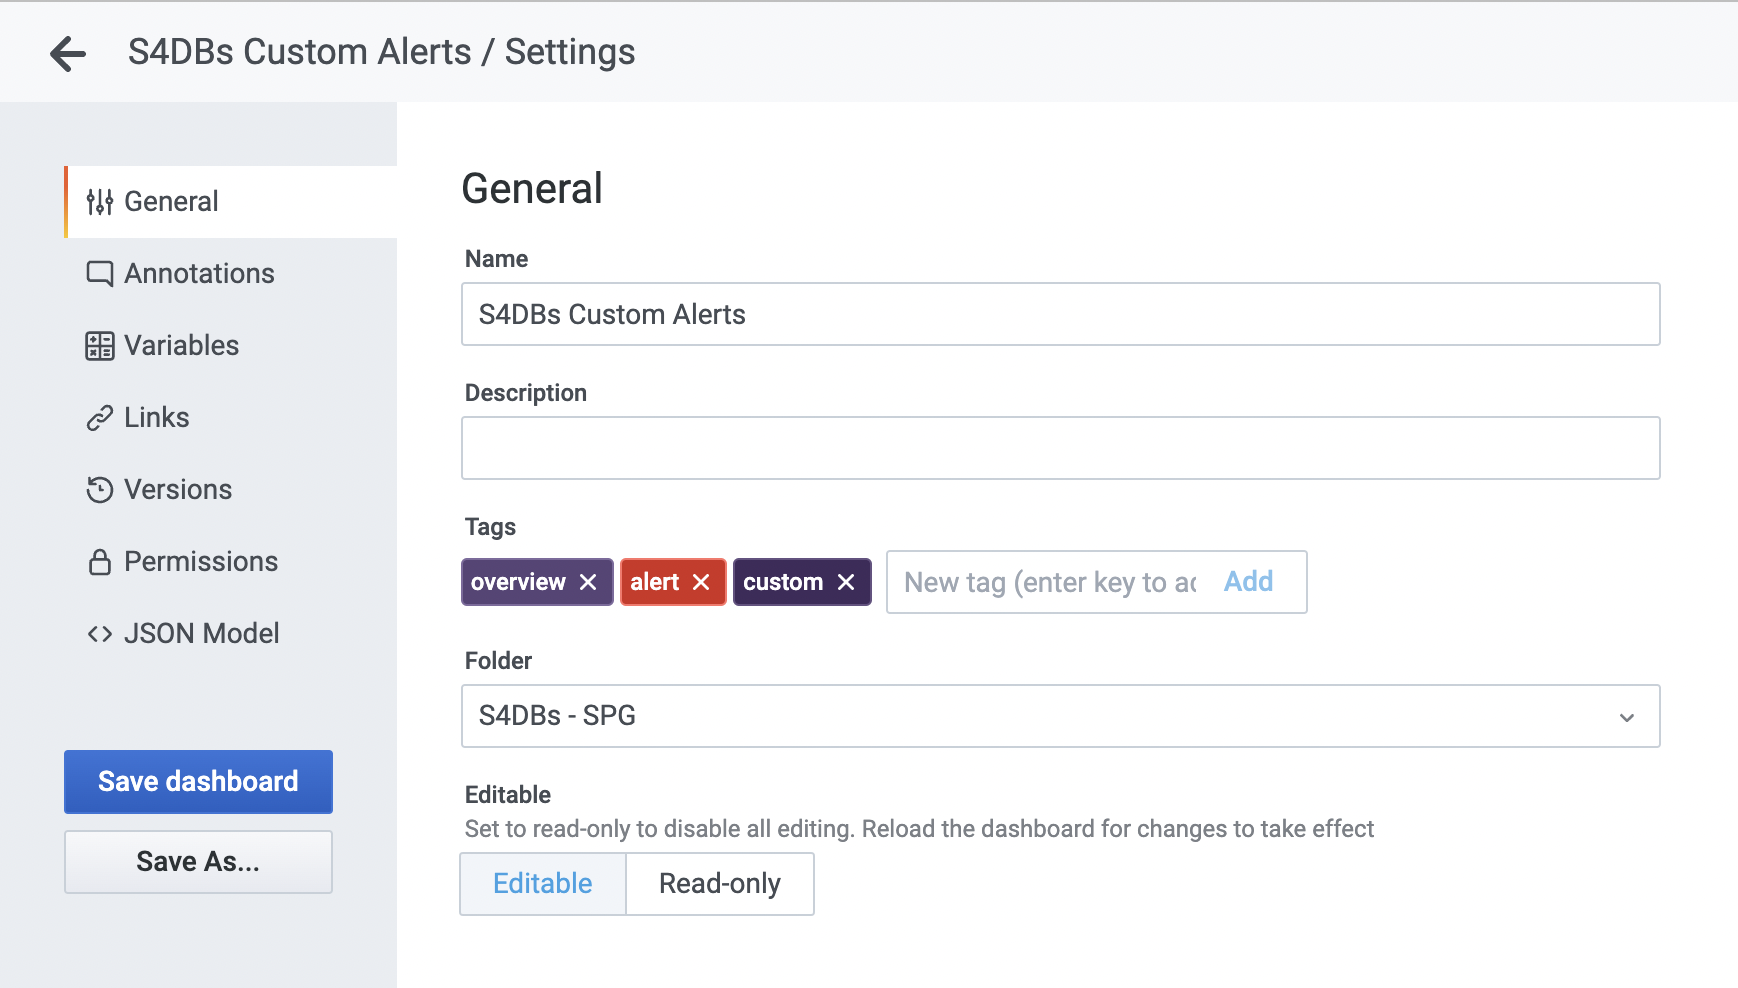
On your new dashboard click on the gear icon again (settings)
-
look for tags and add the tag "custom" - this will make the alerts to appear on the S4DBs - Overview dashoard
-
click on "Save dashboard"
-
remove panels you may not need (click on the panel title and on Remove)
-
add panels via copy and paste from other dashboards (panel title → more → Copy - back to the new dashboard - plus button at upper right → Paste panel from clipboard) - works with panels from other tabs/windows as well
-
add new panels and specify a query
-
Repeat for all panels you need and arrange them as you wish
5.2.2. Adding Alerts
-
Login to Grafana
-
Click on the panel title and edit
-
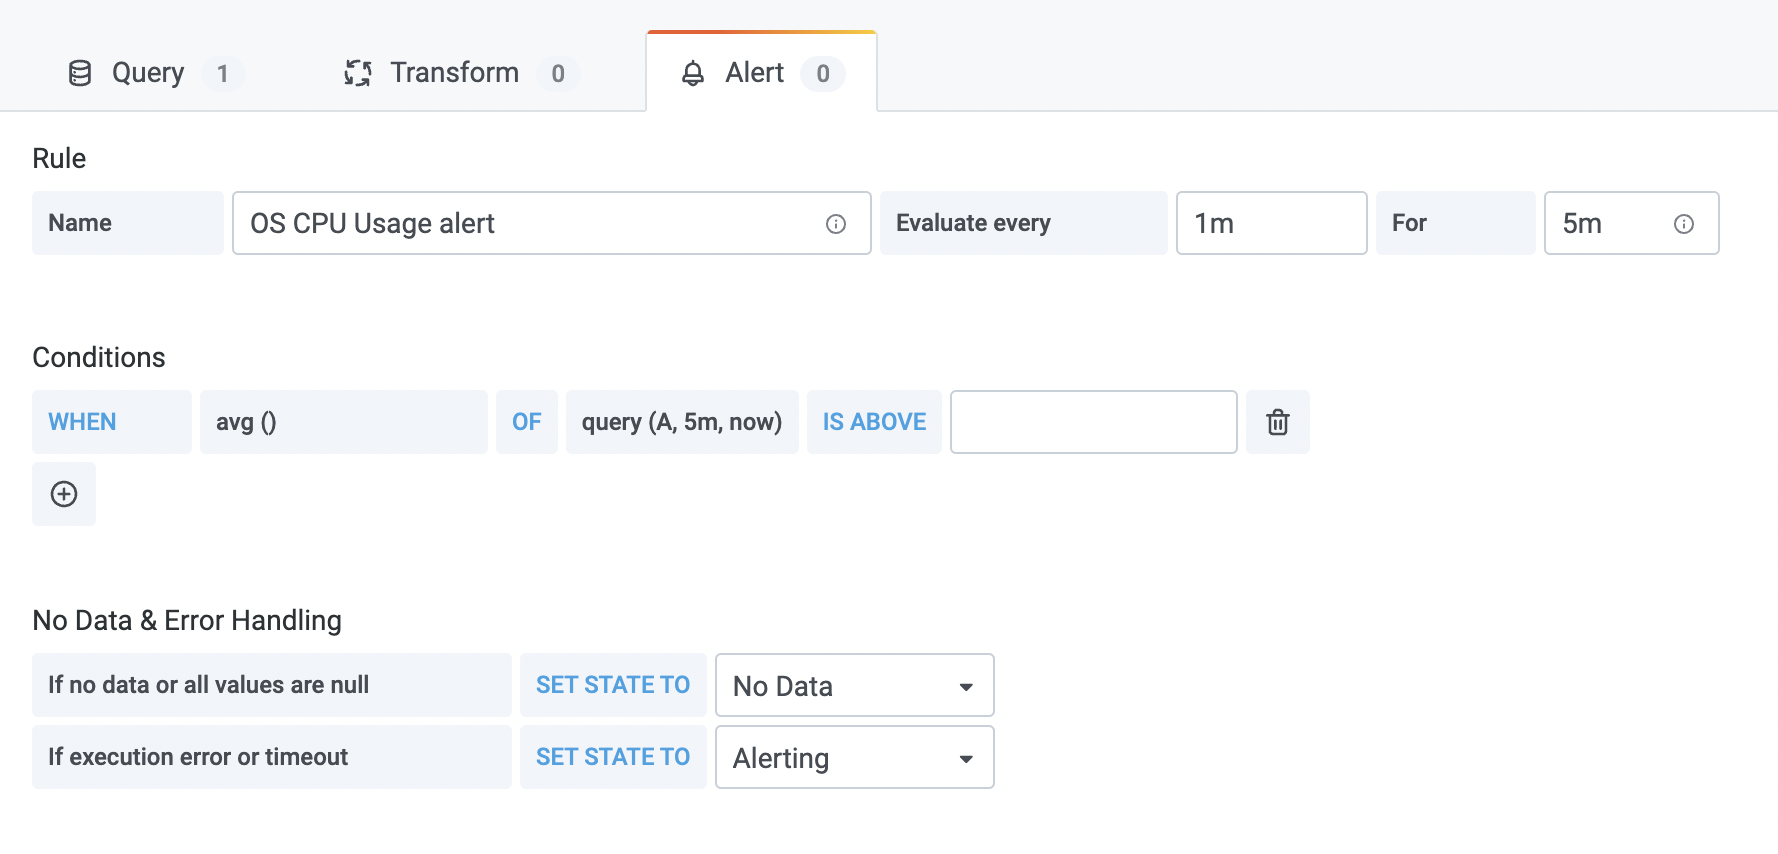
switch over to the "Alert" tab
-
click on "Create Alert"
-
Specify a name for the alert and your conditions
-
add notification channels to e.g. send out emails
-
click on save to persist that alert
|
Note
|
Alerts do only work if no template variable is used within query and for selected datasource! Remove the variable in the query and may add the corresponding part (like hostname port db_name) as "metric". |
5.2.3. Add Notification Channels
-
Login to Grafana
-
Click on the bell on the left
-
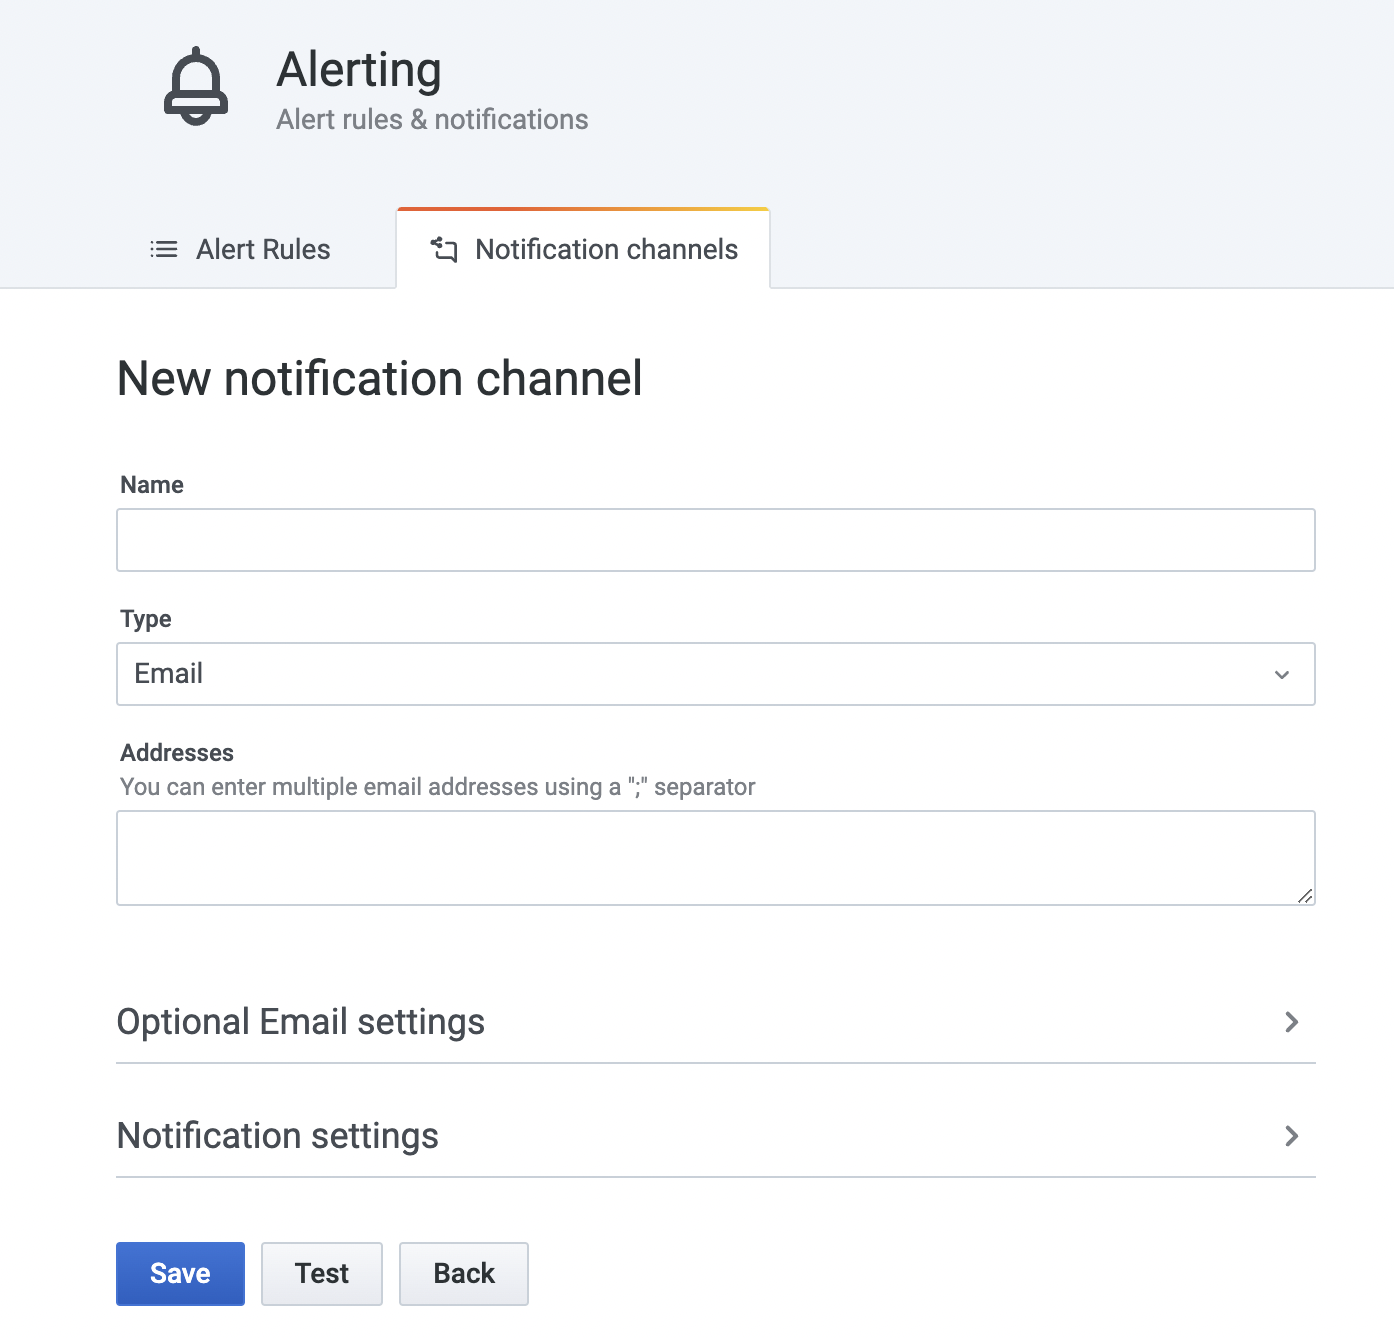
Click on "notification channels"
-
add your channel(s)
|
Important
|
SMTP settings for grafana have to be provided via environment variables in the Docker Compose file. Container has to be re-created to make use of the new variables (docker compose up -d after editing the compose file) |
-
GF_SMTP_ENABLED=true
-
GF_SMTP_HOST=mail.server.com:25
-
GF_SMTP_FROM_ADDRESS=noreply@server.com
-
GF_SMTP_FROM_NAME=speedgain_for_databases_alert
5.2.4. Add a Channel to an alert
-
Login to Grafana
-
Open the Alert Dashboard
-
Click on the panel according to your alert
-
Add the channels in the bottom section and hit save in the upper right to persist dashboard