6.2. Dashboards
Dashboards are grouping metrics into panels like trendcharts and tables to make the KPI visible. Interconnections between those dashboards makes it easier to navigate and to find the root cause of a problem.
Speedgain for Databases has the following build-in not changeable dashboards that can be extended via custom dashboards (not all dashboards are visible via menu and can only be accessed through links or the manage dashboard area):
6.2.1. Db2 (58)
-
Db2 - Overview
-
Application Details for Handle
-
Application Group List
-
Application List
-
Application Throughput
-
Bufferpools
-
CF CMD (pureScale)
-
CF Memory Usage (pureScale)
-
CF System Resources (pureScale)
-
Change History
-
Cluster Application List (pureScale/DPF)
-
Cluster Application Group List (pureScale/DPF)
-
Cluster Live (pureScale/DPF)
-
Cluster SQL Statement Analysis (pureScale/DPF)
-
Cluster SQL Statement Single Detail (pureScale/DPF)
-
Cluster Workload (pureScale/DPF)
-
Config
-
DPF Overview (DPF)
-
HADR
-
Indexes
-
Index Detail
-
Instance Info
-
IO
-
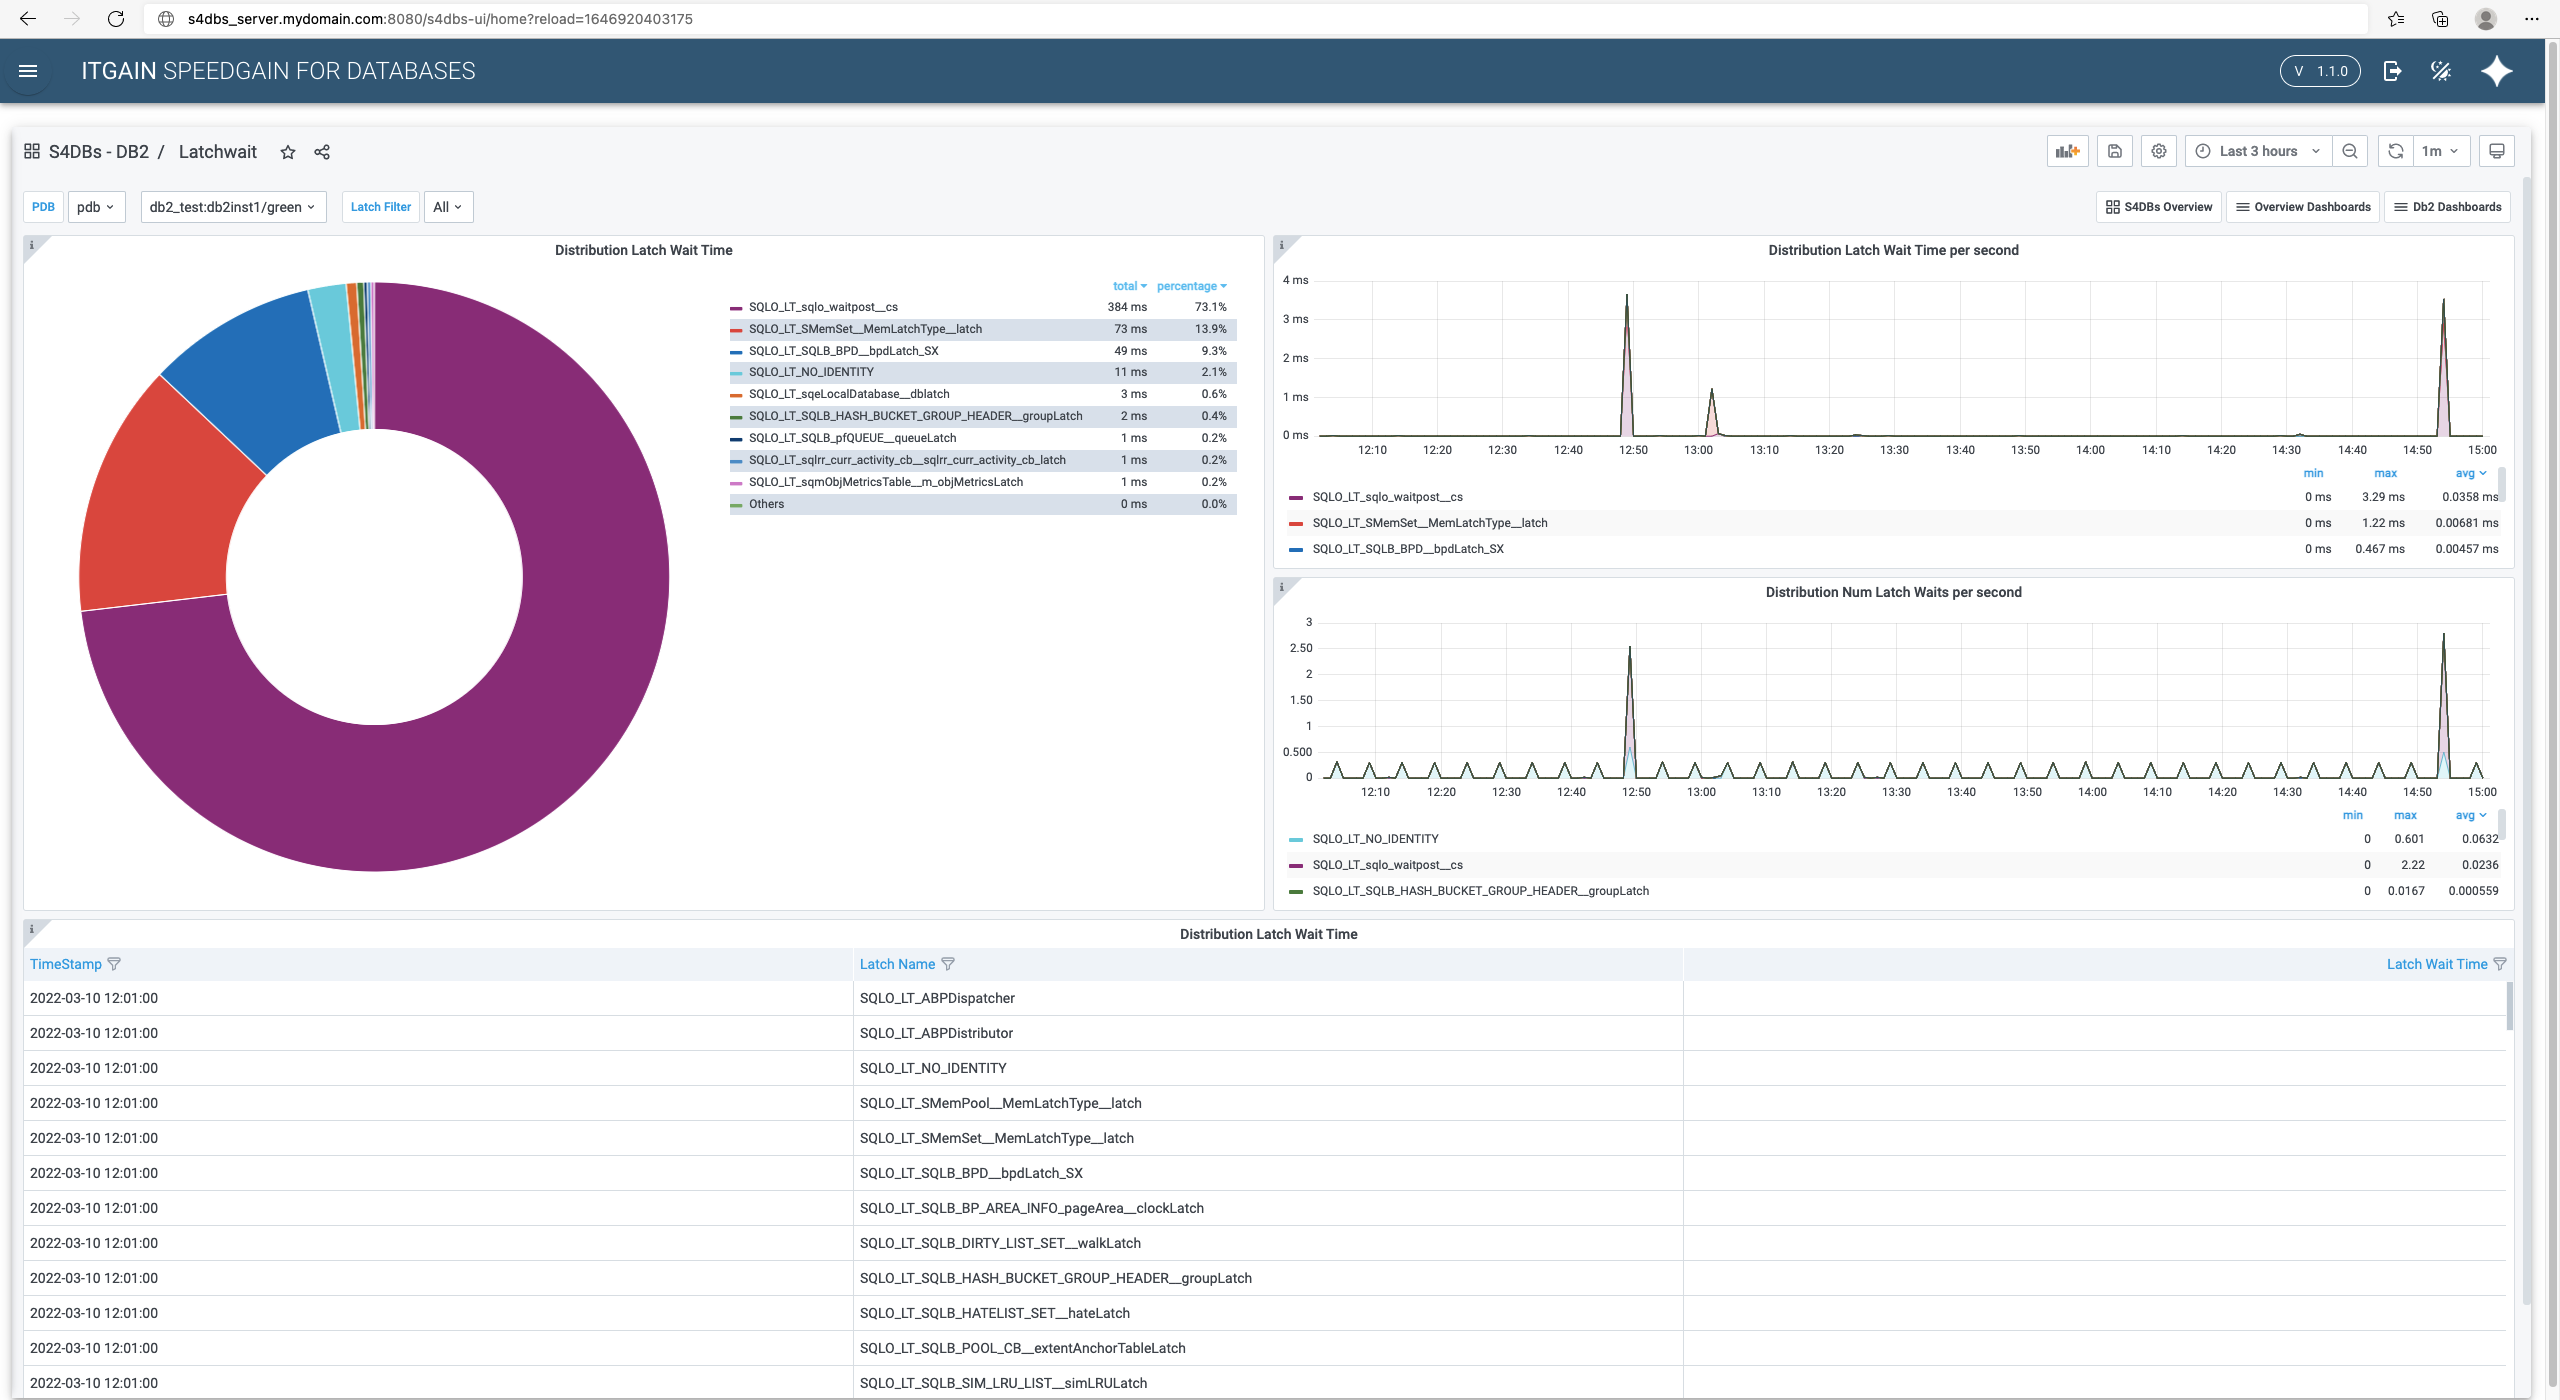
Latchwait
-
Live
-
Lock Events
-
Lock Events - Event Detail
-
Lockwait Inflight
-
Lockwait Inflight - Event Detail
-
Member CF Wait Time (pureScale)
-
Member FCM Throughput (pureScale/DPF)
-
Member IO (pureScale/DPF)
-
Member Page Access (pureScale)
-
Member Throughput (pureScale/DPF)
-
Member Time Distribution (pureScale/DPF)
-
Memory Pools
-
pureScale Overview (pureScale)
-
Routine Single Detail
-
Routines
-
Size Distribution
-
Sort
-
SQL Statement Analysis
-
SQL Statement Heatmap
-
SQL Statement ID (aka STMT ID)
-
SQL Statement Single Detail
-
SQL Statements Inflight (aka Inflight SQL Statements)
-
SQL Statements Inflight Single Detail
-
SQL Throughput (aka SQL)
-
System Resources
-
Tables
-
Tables Detail
-
Tablespaces
-
Temp Usage
-
Transaction Log
-
Utilities
-
WLM CPU Velocity
-
WLM Workload
-
Workload
6.2.2. PostgreSQL (10)
-
PG - Overview
-
Application List
-
Application Single Detail
-
Configuration
-
Lockwait
-
SQL Statement Analysis
-
SQL Statements Single Detail
-
Tablespaces
-
Workload
-
Write Ahead Log - WAL
6.2.3. SQL Server (23)
-
SQL Server - Overview
-
Activity
-
Backup
-
Blocking Details
-
Blocking Overview
-
Configurations
-
DB - Size|Growth
-
DB - Used Space
-
Index - Missing
-
Index - Missing - Details
-
Index - Unused
-
Index - Usage - Details
-
IO Stats/Database
-
IO Stats/Volume
-
Live
-
Memory
-
Performance Counter Details
-
Query - Details
-
Query - Usage Analysis
-
TempDB
-
Volume Stats
-
Waits
-
Workload Group Statistics
6.2.4. Azure SQL Database (16)
-
Azure SQL Database - Overview
-
Activity
-
Blocking Details
-
Blocking Overview
-
Configuration
-
Consumption
-
Database Size
-
Index Details
-
Index Missing Details
-
Index Missing/Unused
-
Live
-
Memory
-
Performance Counter Details
-
Query Details
-
Query Usage Analysis
-
Waits
6.2.5. Oracle (14)
-
Oracle - Overview
-
Locks
-
OS-Stats
-
Performance Detail
-
Performance Overview
-
RMAN Status
-
Scheduler Job Details
-
Session
-
Session List
-
SGA and PGA Usage
-
SQL Statistics
-
System Time Model Statistics
-
System Waitclasses
-
Tablespace and Datafile Usage
6.2.6. Linux (7)
-
OS - Overview
-
CPU
-
CPU Distribution
-
Disk Throughput
-
Filesystem Usage
-
RAM
-
Workload
6.2.7. MariaDB / MySQL (3)
-
MariaDB / MySQL - Overview
-
Generic
-
Workload
6.2.8. MongoDB (6)
-
MongoDB - Overview
-
Database and Collection Detail
-
Generic
-
Top Collections
-
Top Databases
-
Workload
6.2.9. GenericDB (2)
-
Generic DB - Overview
-
Generic DB Detail
6.2.10. Self Monitoring (3)
-
S4DBs Overview
-
S4DBs Collector Status
-
S4DBs Hypertables