5.5. Create a Custom Dashboard
Speedgain for Databases comes with lots of buit-in Dashboards that group metrics from one or more collectors on a single page. To extend the number of displayed metrics and/or series or to group them based on your needs Speedgain for Databases can be extended by custom dashboards.
-
login to grafana (open up the speedgain for databases url with port 3000 - default port)
-
open the dashboard you want to use as a template, e.g. the Db2 Workload Dashboard (Url: …:3000/d/4aGkQx1Wk/)
-
hit the gear icon (settings)
-
click on "Save as.."
-
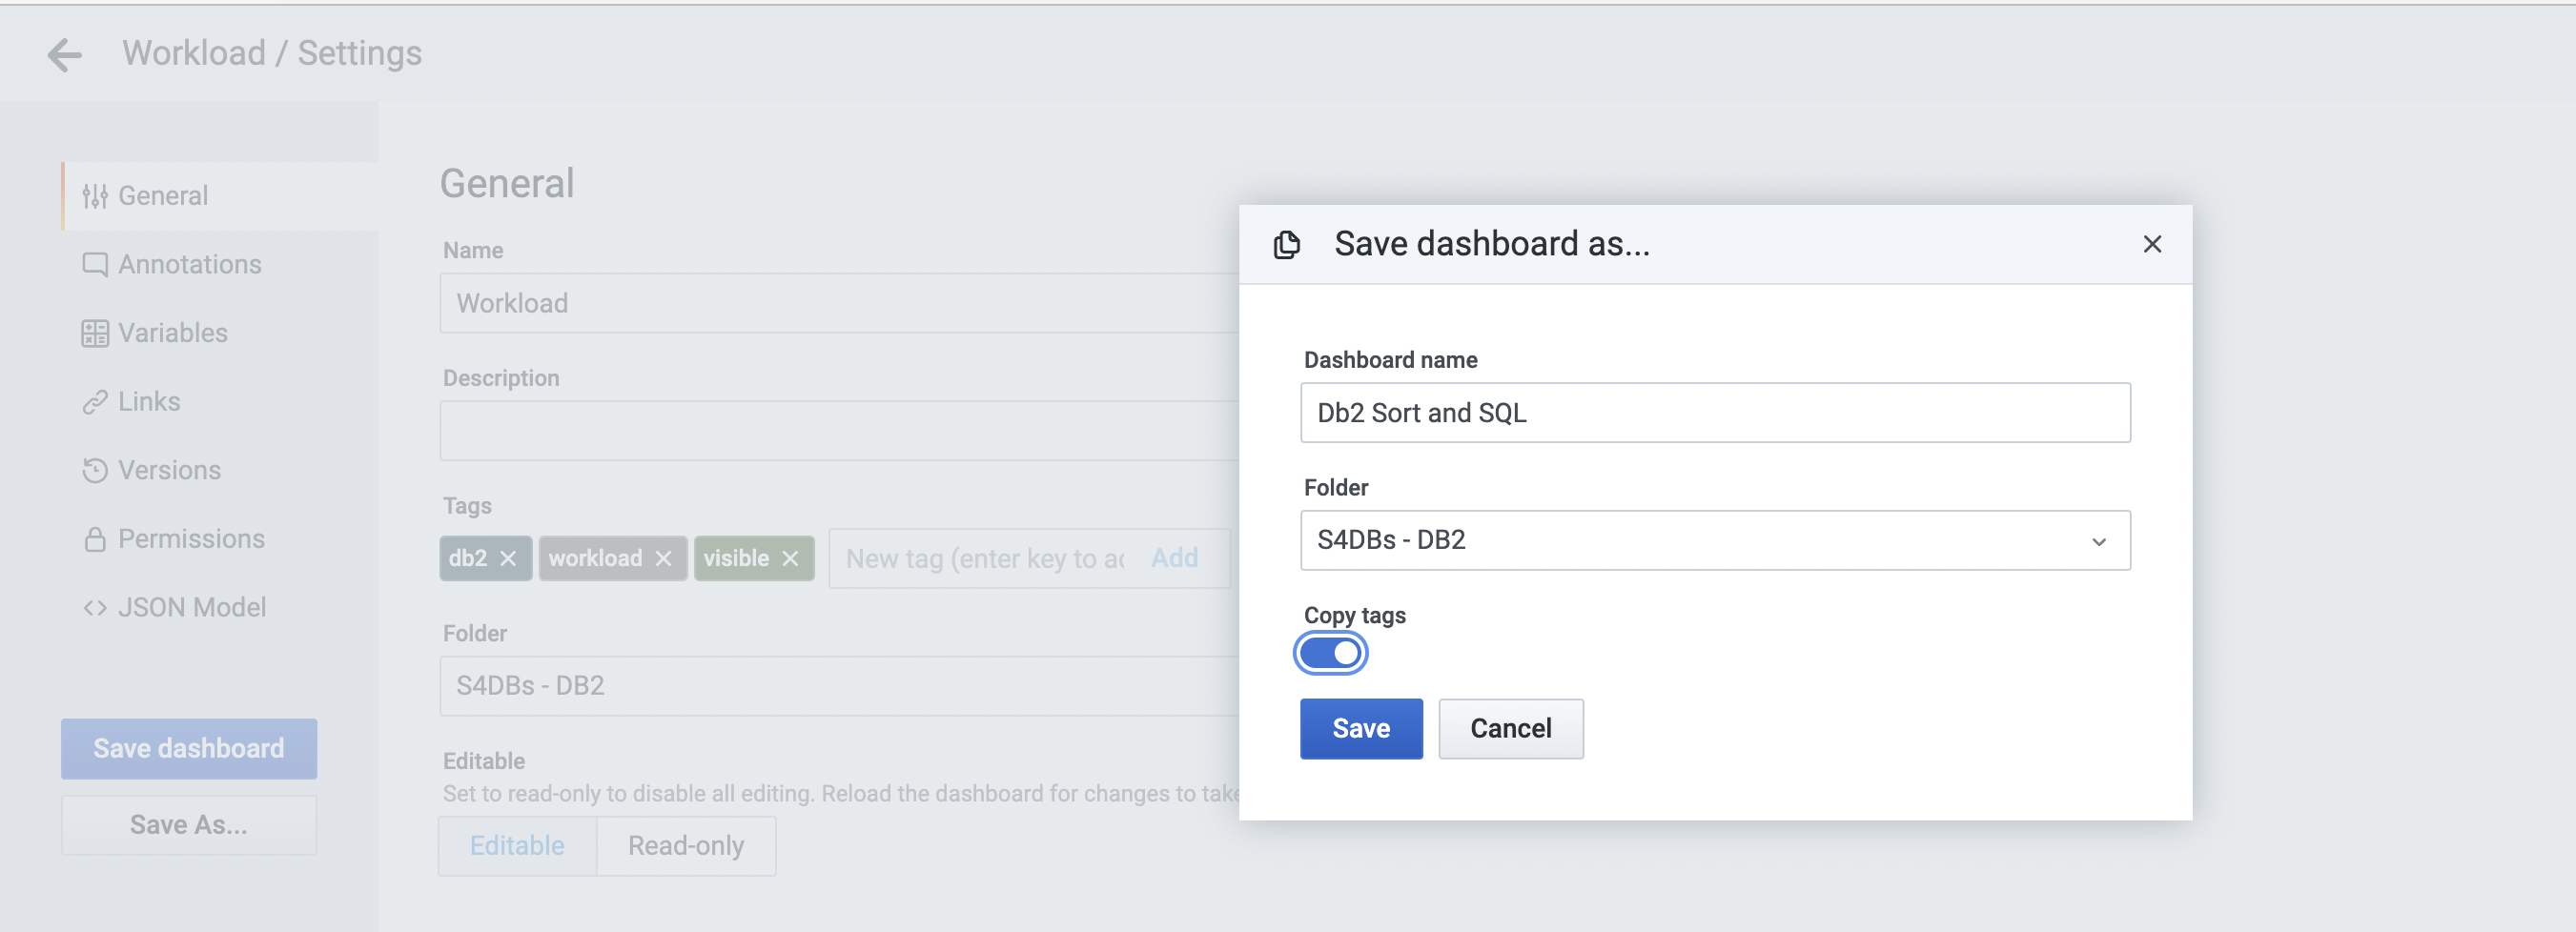
Give the dashboard a name of your choice, select a folder or create a new one, enable copy tags (tags will make it appear in the menu) and click on save
-
remove panels you may not need (click on a panel title → Remove)
-
add panels via copy and paste from other dashboards (panel title → more → Copy - back to the new dashboard - plus button at upper right → Paste panel from clipboard) - works with panels from other tabs/windows as well
-
add new panels and specify your query
-
Repeat for all panels you need and arrange them as you wish
|
Note
|
Some built-in dashboards make use of variables and filters. If you copy over panels from those you will have to create those variables on your dashboards as well or rewrite the query to make them work! |